


In this chapter you’ll learn how to use the most effective indicators on Forex.

RSI(Relative Strength Index): The Relative Strength Index (RSI) is an extremely usefuland popular momentum oscillator. The RSI compares the magnitude of recent gains to the magnitude of recent losses and turns that information into a number that ranges from o to 100. There are multiple ways that you can use the RSI. Yu can use it to spot Overbought / oversold levels, to spot divergences that show you a trend is losing steam, or you can use it to confirm a trend.
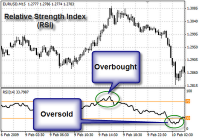
a.Overbought/Oversold: RSI above 70 usually means the currency pair is overbought, so a top might be near. RSI below 30 means the currency pair is oversold so a bottom might be near. Generally, if the RSI rises above 30 it is considered a bullish signal. If the RSI falls below 70, it is a bearish signal. Some traders indent the long-term trend and then use extreme readings for entry points. If the long-term trend is bullish, then oversold readings could mark potential entry points.
b. Divergences: Buy and sell signals can also be generated by looking for positive and negative divergences between the RSI and the currency pair price. If the price reaches a higher high but RSI isn't able to reach a new high, there’s a bearish divergence. If prices reach a new low, and RSI can’t reach a new low, there’s a bullish divergence. Divergences that occur after an overbought or oversold reading usually provide more reliable signals.

c. Centerline Crossover: A reading above 50 indicates that average gains are higher than average losses and a reading below indicates that losses are winning the battle. Some traders look for a mover above 50 to confirm bullish signals or a mover below 50 to confirm bearish signals.
2- MACD (Moving Average Convergence/ Divergence): MACD, invented in 1979 by Gerald Appeal, is one of the most popular technical indicators in trading. MACD is appreciated by traders the world over for its simplicity and flexibility because it can be used either as a trend or momentum indicator. With MACD you'll be able to spot bull divergences and bear divergences which are rare and effective patterns on Forex.

a. Bullish Divergence: When the price reaches a new low, and MACD can't reach a new low, there's a bullish divergence which shows that the down trend is losing steam and an uptrend might be near.Bullish divergences are (as you may have guessed) bullish signs and they come in many forms. For instance, sector breadth indicators are showing that the bank sector is starting to move higher again (after being in historically oversold territory). Now, when breadth (internal) indicators are moving higher while the external market is moving lower, that's a bullish divergence. It's bullish because breadth (internal) indicators typically lead external markets.
Below is a chart of the Financial Select Sector SPDR Fund (XLF). It's basically the financial sector in the S&P500. It's an ETF which tracks the financial index, and is market-cap weighted, which just means that the stocks with the largest market-caps have the most influence on the index. So it's the financial part of the external market.
b. Bearish Divergences: When the price reaches a new high, and MACD can't reach a new high, there's a bearish divergence which shows that the uptrend is losing steam and a downtrend might be near. A bearish divergence means the chart shows rising price highs, but the indicator highs, in this case the RSI highs are flat or declining. This suggests a lot of momentum. It should be noted that divergences can be quite extended in a trending market.
MACD is not particularly good identifying overbought and oversold levels. Even though it is possible to identify levels that historically represent overbought and oversold levels, MACD doesn't have any upper or lower limits to bind its movement. MACD can continue to overextend beyond historical extremes.

c. Confirmation Indicator: You can also MACD as a confirmation indicator. If MACD Histogram is above 0 this means we're in an uptrend. If MACD histogram is below 0, we're in a downtrend.Using a cross above 0 or below 0 as a buy or sell signal respectively, works well during strong trends, but when the market is choppy, this technique gives too much false signals. So, I only recommend using MACD histogram above 0 or below 0 as a confirmation of other indicators buy and sell signals.Unfortunately, during choppy markets, MACD gives too much false signals that's why I just use MACD to spot divergences and to confirm traders. That's the best way to use MACD on any kind of market.
3- Stochastic Oscillator: The stochastic Oscillator is a momentum indicator that shows the location of current close relative to the high/low range over a set number of periods. Closing levels that are consistently near the top of the range indicate accumulation (buying pressure) and those near the bottom of the range indicate distribution (selling pressure).
Buy and sell signals can also be given when % K crosses above or below % D. However, crossover signals are quite frequent and can result in a lot of false signals.
One of the most reliable stochastic signals is to wait for a divergence to develop from overbought or oversold levels. Once the oscillator reaches overbought levels, wait for a negative divergence to develop and then a cross below 80.for a buy signal, wait for a positive divergence to develop after the indicator moves below 20
RSI(Relative Strength Index): The Relative Strength Index (RSI) is an extremely usefuland popular momentum oscillator. The RSI compares the magnitude of recent gains to the magnitude of recent losses and turns that information into a number that ranges from o to 100. There are multiple ways that you can use the RSI. Yu can use it to spot Overbought / oversold levels, to spot divergences that show you a trend is losing steam, or you can use it to confirm a trend.
a.Overbought/Oversold: RSI above 70 usually means the currency pair is overbought, so a top might be near. RSI below 30 means the currency pair is oversold so a bottom might be near. Generally, if the RSI rises above 30 it is considered a bullish signal. If the RSI falls below 70, it is a bearish signal. Some traders indent the long-term trend and then use extreme readings for entry points. If the long-term trend is bullish, then oversold readings could mark potential entry points.
b. Divergences: Buy and sell signals can also be generated by looking for positive and negative divergences between the RSI and the currency pair price. If the price reaches a higher high but RSI isn't able to reach a new high, there’s a bearish divergence. If prices reach a new low, and RSI can’t reach a new low, there’s a bullish divergence. Divergences that occur after an overbought or oversold reading usually provide more reliable signals.
c. Centerline Crossover: A reading above 50 indicates that average gains are higher than average losses and a reading below indicates that losses are winning the battle. Some traders look for a mover above 50 to confirm bullish signals or a mover below 50 to confirm bearish signals.
2- MACD (Moving Average Convergence/ Divergence): MACD, invented in 1979 by Gerald Appeal, is one of the most popular technical indicators in trading. MACD is appreciated by traders the world over for its simplicity and flexibility because it can be used either as a trend or momentum indicator. With MACD you'll be able to spot bull divergences and bear divergences which are rare and effective patterns on Forex.
a. Bullish Divergence: When the price reaches a new low, and MACD can't reach a new low, there's a bullish divergence which shows that the down trend is losing steam and an uptrend might be near.Bullish divergences are (as you may have guessed) bullish signs and they come in many forms. For instance, sector breadth indicators are showing that the bank sector is starting to move higher again (after being in historically oversold territory). Now, when breadth (internal) indicators are moving higher while the external market is moving lower, that's a bullish divergence. It's bullish because breadth (internal) indicators typically lead external markets.
Below is a chart of the Financial Select Sector SPDR Fund (XLF). It's basically the financial sector in the S&P500. It's an ETF which tracks the financial index, and is market-cap weighted, which just means that the stocks with the largest market-caps have the most influence on the index. So it's the financial part of the external market.
b. Bearish Divergences: When the price reaches a new high, and MACD can't reach a new high, there's a bearish divergence which shows that the uptrend is losing steam and a downtrend might be near. A bearish divergence means the chart shows rising price highs, but the indicator highs, in this case the RSI highs are flat or declining. This suggests a lot of momentum. It should be noted that divergences can be quite extended in a trending market.
MACD is not particularly good identifying overbought and oversold levels. Even though it is possible to identify levels that historically represent overbought and oversold levels, MACD doesn't have any upper or lower limits to bind its movement. MACD can continue to overextend beyond historical extremes.
c. Confirmation Indicator: You can also MACD as a confirmation indicator. If MACD Histogram is above 0 this means we're in an uptrend. If MACD histogram is below 0, we're in a downtrend.Using a cross above 0 or below 0 as a buy or sell signal respectively, works well during strong trends, but when the market is choppy, this technique gives too much false signals. So, I only recommend using MACD histogram above 0 or below 0 as a confirmation of other indicators buy and sell signals.Unfortunately, during choppy markets, MACD gives too much false signals that's why I just use MACD to spot divergences and to confirm traders. That's the best way to use MACD on any kind of market.
3- Stochastic Oscillator: The stochastic Oscillator is a momentum indicator that shows the location of current close relative to the high/low range over a set number of periods. Closing levels that are consistently near the top of the range indicate accumulation (buying pressure) and those near the bottom of the range indicate distribution (selling pressure).
Buy and sell signals can also be given when % K crosses above or below % D. However, crossover signals are quite frequent and can result in a lot of false signals.
One of the most reliable stochastic signals is to wait for a divergence to develop from overbought or oversold levels. Once the oscillator reaches overbought levels, wait for a negative divergence to develop and then a cross below 80.for a buy signal, wait for a positive divergence to develop after the indicator moves below 20
No Comment.